

Check UK Summer 2026 Weather With Postcode Lookup
BBC Verify launches an interactive tool to check 2026 UK summer temperatures and rainfall by postcode, showing a record-breaking hot season.

Stock photo for illustration only, not from the actual event
- The UK faced its hottest summer on record in 2026 with repeated heatwaves and droughts.
- BBC Verify developed a postcode lookup tool to check local weather data.
- The average daily maximum temperature reached 21.3°C, up 2.4°C from 1991-2020 averages.
- Total rainfall dropped to 195mm on average, sitting 23% below typical levels.
BBC Verify has introduced a new interactive tool allowing residents across the UK to check specific weather conditions in their local areas for the summer of 2026. By typing in a postcode, users can access detailed insights into how much heat and rainfall their specific neighbourhood experienced during a season marked by record-breaking temperatures, repeated heatwaves, and widespread droughts.
However, weather patterns were not uniform across the entire nation. According to the report data:
- Southern England and Wales experienced temperatures far above typical levels.
- Scotland and Northern Ireland saw temperatures closer to normal ranges.
- North-western Scotland was the only region to record higher-than-usual summer rainfall.
Looking at the broader national figures, the average daily maximum temperature for the summer of 2026 hit 21.3°C, marking a 2.4°C increase compared to the 1991–2020 baseline period. Meanwhile, the total average rainfall across the country dropped to 195 millimetres, which is 23% below the historical average for those summer months. Although summer seasons are naturally drier, this year proved exceptional, triggering drought declarations across large parts of the country.
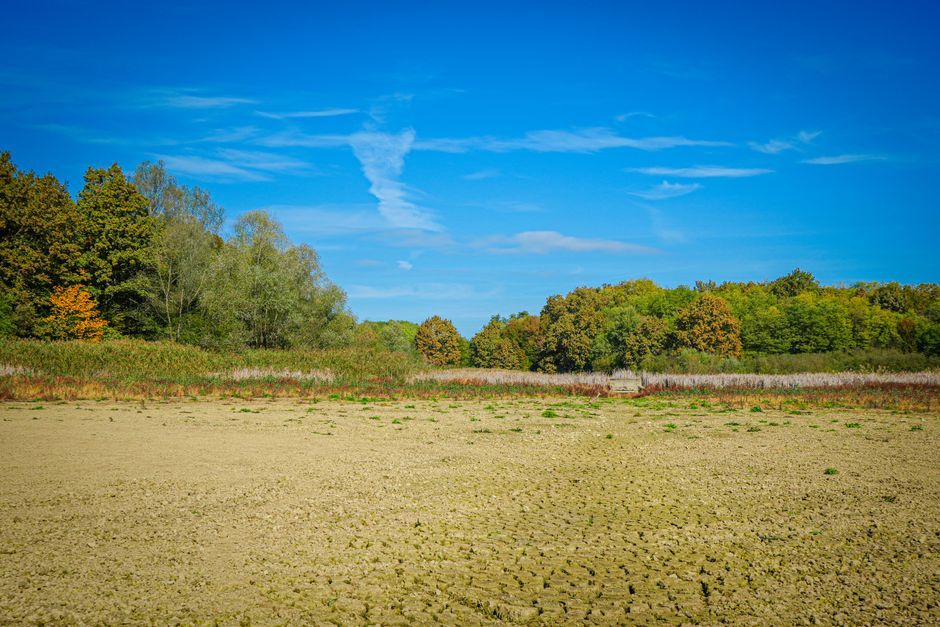
Stock photo for illustration only, not from the actual event
Translating complex meteorological grid data into an accessible postcode lookup tool highlights the evolving power of data journalism. By bridging macro-level climate statistics with hyper-local geographies, media outlets can help communities visualize the tangible, localized impacts of global warming and shifting weather extremes in real-time.
Underpinning this lookup tool is the HadUK Grid dataset, produced by the Met Office Hadley Centre. This dataset serves as one of the primary resources utilized by scientists to monitor and research the evolving climate of the United Kingdom, covering the entire landmass of the UK with the exception of the Channel Islands.
The HadUK dataset maps temperature and rainfall data across a uniform grid of 1km by 1km squares. Values are generated using observations from land-based weather stations nationwide, incorporating secondary variables such as altitude, terrain, and coastal proximity to scientifically estimate conditions between stations. The results displayed for each postcode represent a mean average of that specific grid cell and surrounding cells within a 5km to 7km radius, smoothing out sharp localized discrepancies.
The data for 2026 currently remains provisional, as fewer observations are factored into calculations due to reporting lags, meaning precise figures may shift slightly as more records become finalized. Historical baselines are calculated across a 30-year span from 1991 to 2020, aligning with UN World Meteorological Organization standards, with methodology support provided by Met Office experts Dan Hollis, Amy Doherty, and Oli Claydon.
Source: BBC Science & Environment
Found something wrong in this article? Report an issue with this article
Comments
Leave a Comment